Net Natural Decrease Approaching for Non-Hispanic Whites
Recent population estimates by age, race, gender and Hispanic origin for Maryland from the U.S. Census Bureau revealed that all of Maryland’s population growth in 2014, and indeed since 2010, was the result of the growth in minority populations, where minority is everyone other than non-Hispanic white alone. Growth in Maryland was led by Hispanics, followed by African Americans, Asians and those of two or more races. There was a decline in non-Hispanic whites due to net domestic outmigration. (See Hispanics Continue to Lead Maryland’s Population Gain in 2014).
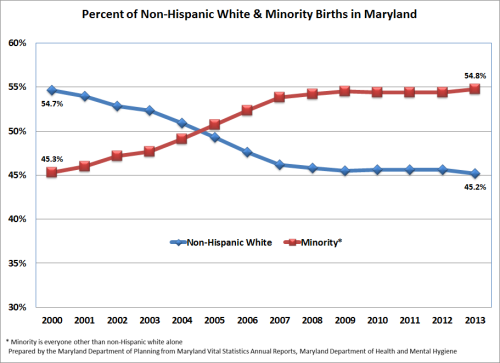
Percent of Non-Hispanic White & Minority Births in Maryland
Birth and death data by race are currently available through 2013 from the Maryland Department of Health and Mental Hygiene. Non-Hispanic whites made up 45 percent, and minorities 55 percent, of all births in Maryland in 2013, a complete reversal from 2000 when non-Hispanic white births were 55 percent of the total and minority births were 45 percent. Non-Hispanic white births have been below 50 percent of all births since 2005.

Percent of Non-Hispanic White & Minority Deaths in Maryland
Reliable death data for non-Hispanic whites and minorities begin in 2005. Data for the 2005 to 2013 period show non-Hispanic white deaths accounting for approximately 70 percent of all deaths. This is due to the fact that although non-Hispanic whites make up around 53 percent of the state’s current population, it has a much older age structure than minority groups, with non-Hispanic whites accounting for 68 percent of the population ages 65 and over.

Percent of Maryland’s Population Which is Non-Hispanic White and Minority by Single Year of Age
With lower births and higher deaths, net natural increase (births minus deaths) for non-Hispanic whites has fallen from nearly 6,200 in 2005 to only a little more than a 1,100 by 2013. If the current trend continues, when 2014 data become available it may well show that there were more non-Hispanic white deaths than births, a condition known as “net natural decrease.” Regardless if net natural decrease for non-Hispanic whites happens in 2014 or at some later date, the older age structure of non-Hispanic whites combined with their net domestic out migration and the strong foreign immigration of Hispanic, Asian and African populations to Maryland will most likely lead to Maryland becoming a majority minority state by 2020.

Net Natural Increase in Maryland, 2005 to 2013


